AI-Powered Financial Intelligence & Forecasting
Know where you stand.
Know where you're going.
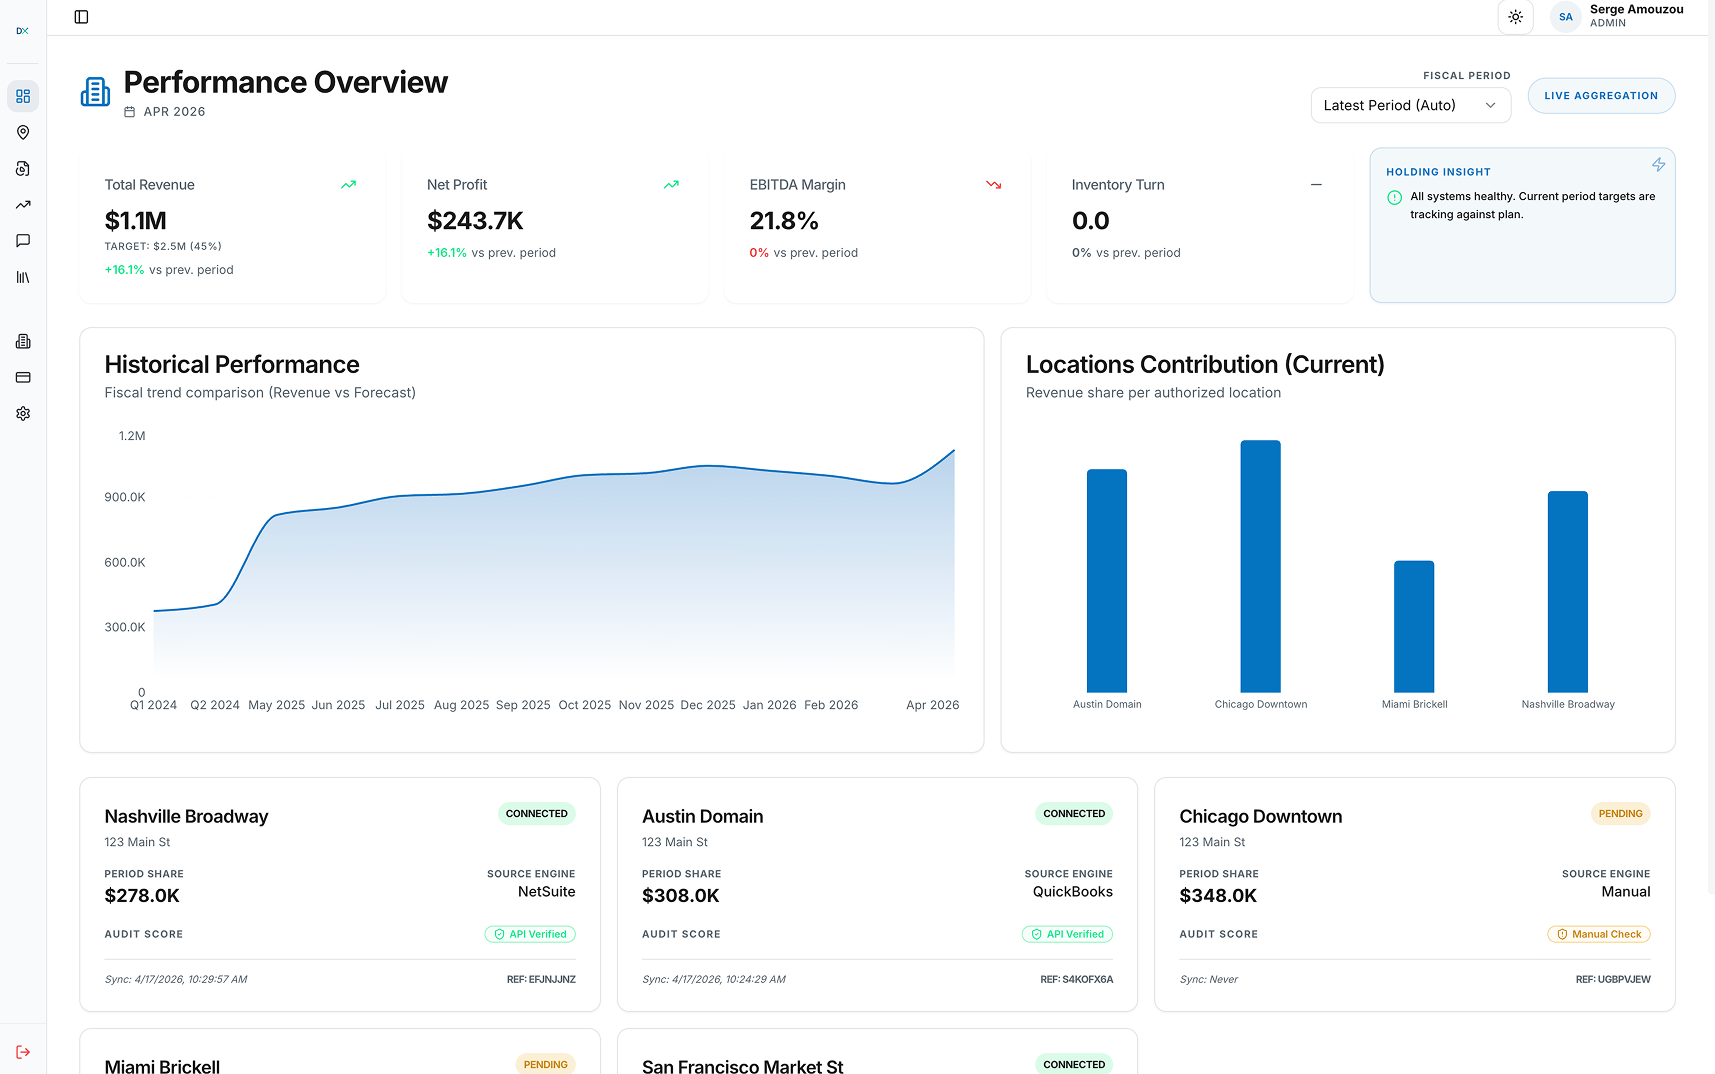
Connect QuickBooks, NetSuite, or Sage Intacct. Get consolidated financials, AI-powered analysis, and Bear/Base/Bull scenario forecasting — across every business unit you manage.
Connects to:
QuickBooks
NetSuite
Sage Intacct
Excel / CSV
app.datatrixs.com/dashboard