A complete financial intelligence stack — from raw accounting data to board-ready analysis — designed
specifically for organizations managing multiple entities.
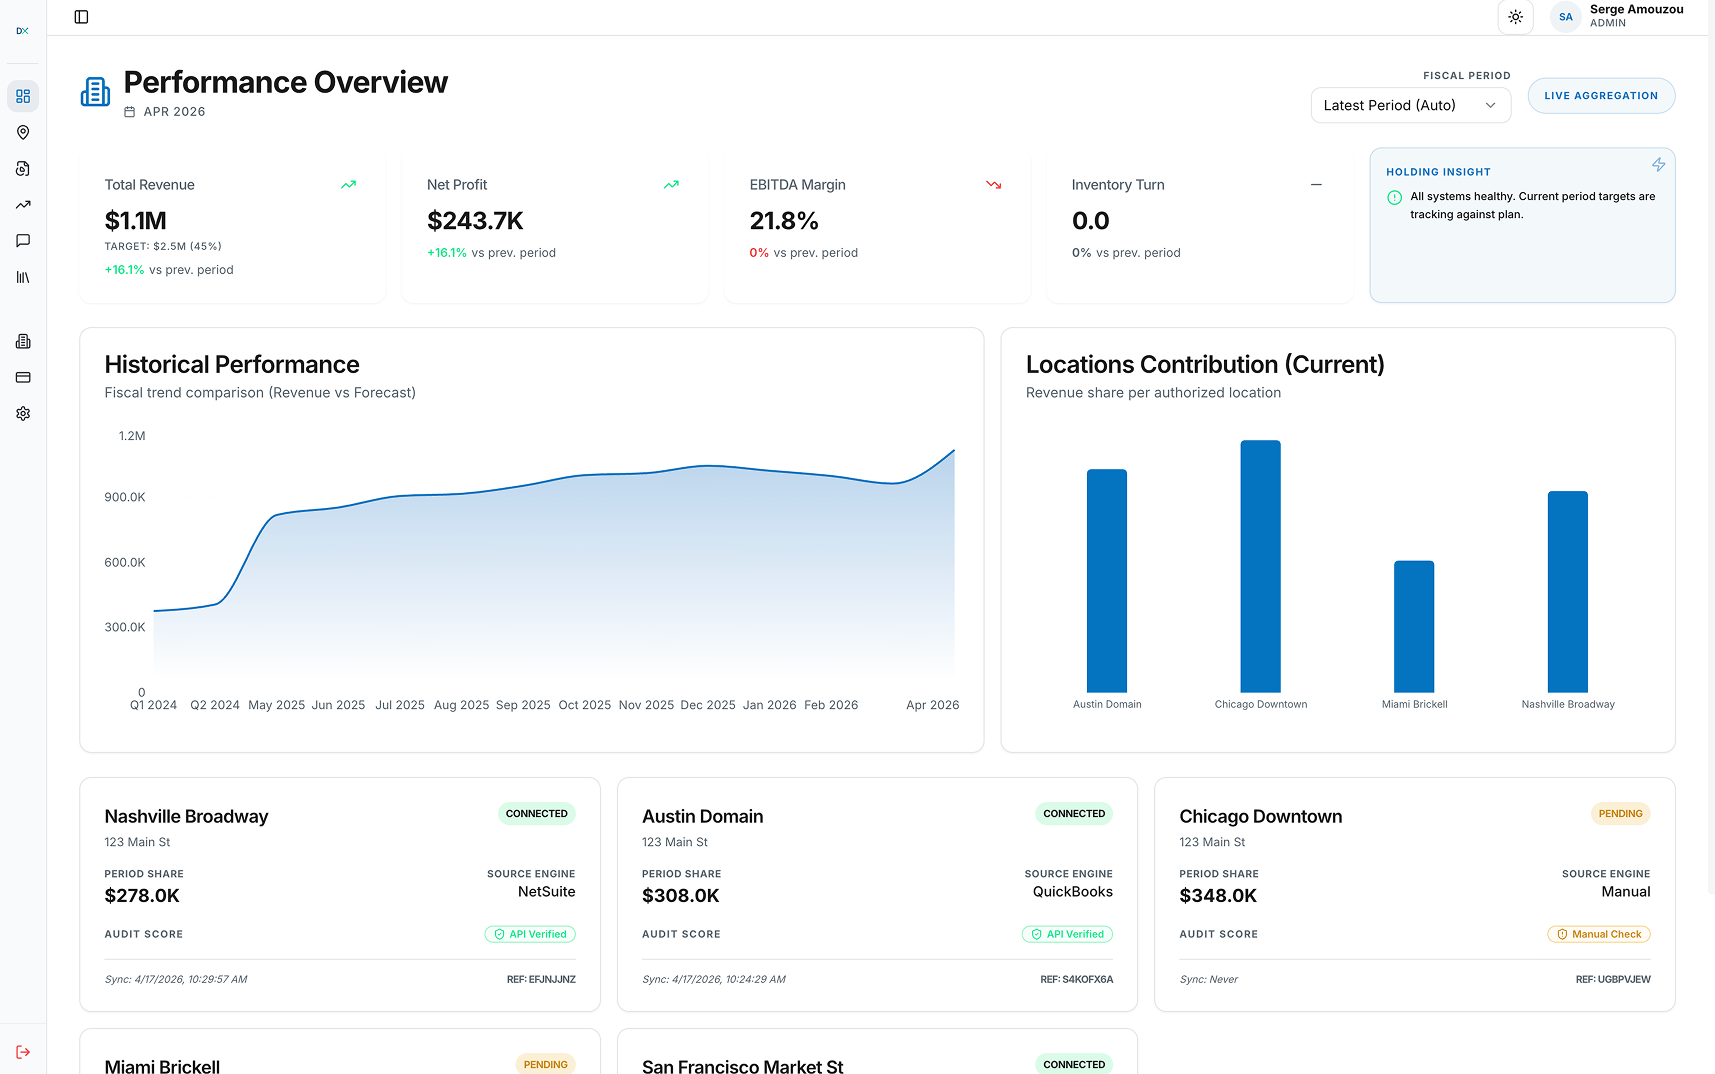
Your entire organization's financial performance, aggregated and normalized, in a single view. No manual
consolidation. No waiting for month-end.
Revenue, COGS, gross margin, and a vertical-specific 4th
KPI for your business type
Period-over-period comparisons across all units
simultaneously
Drill from portfolio view down to a single unit's full
P&L in one click
app.datatrixs.com/dashboard
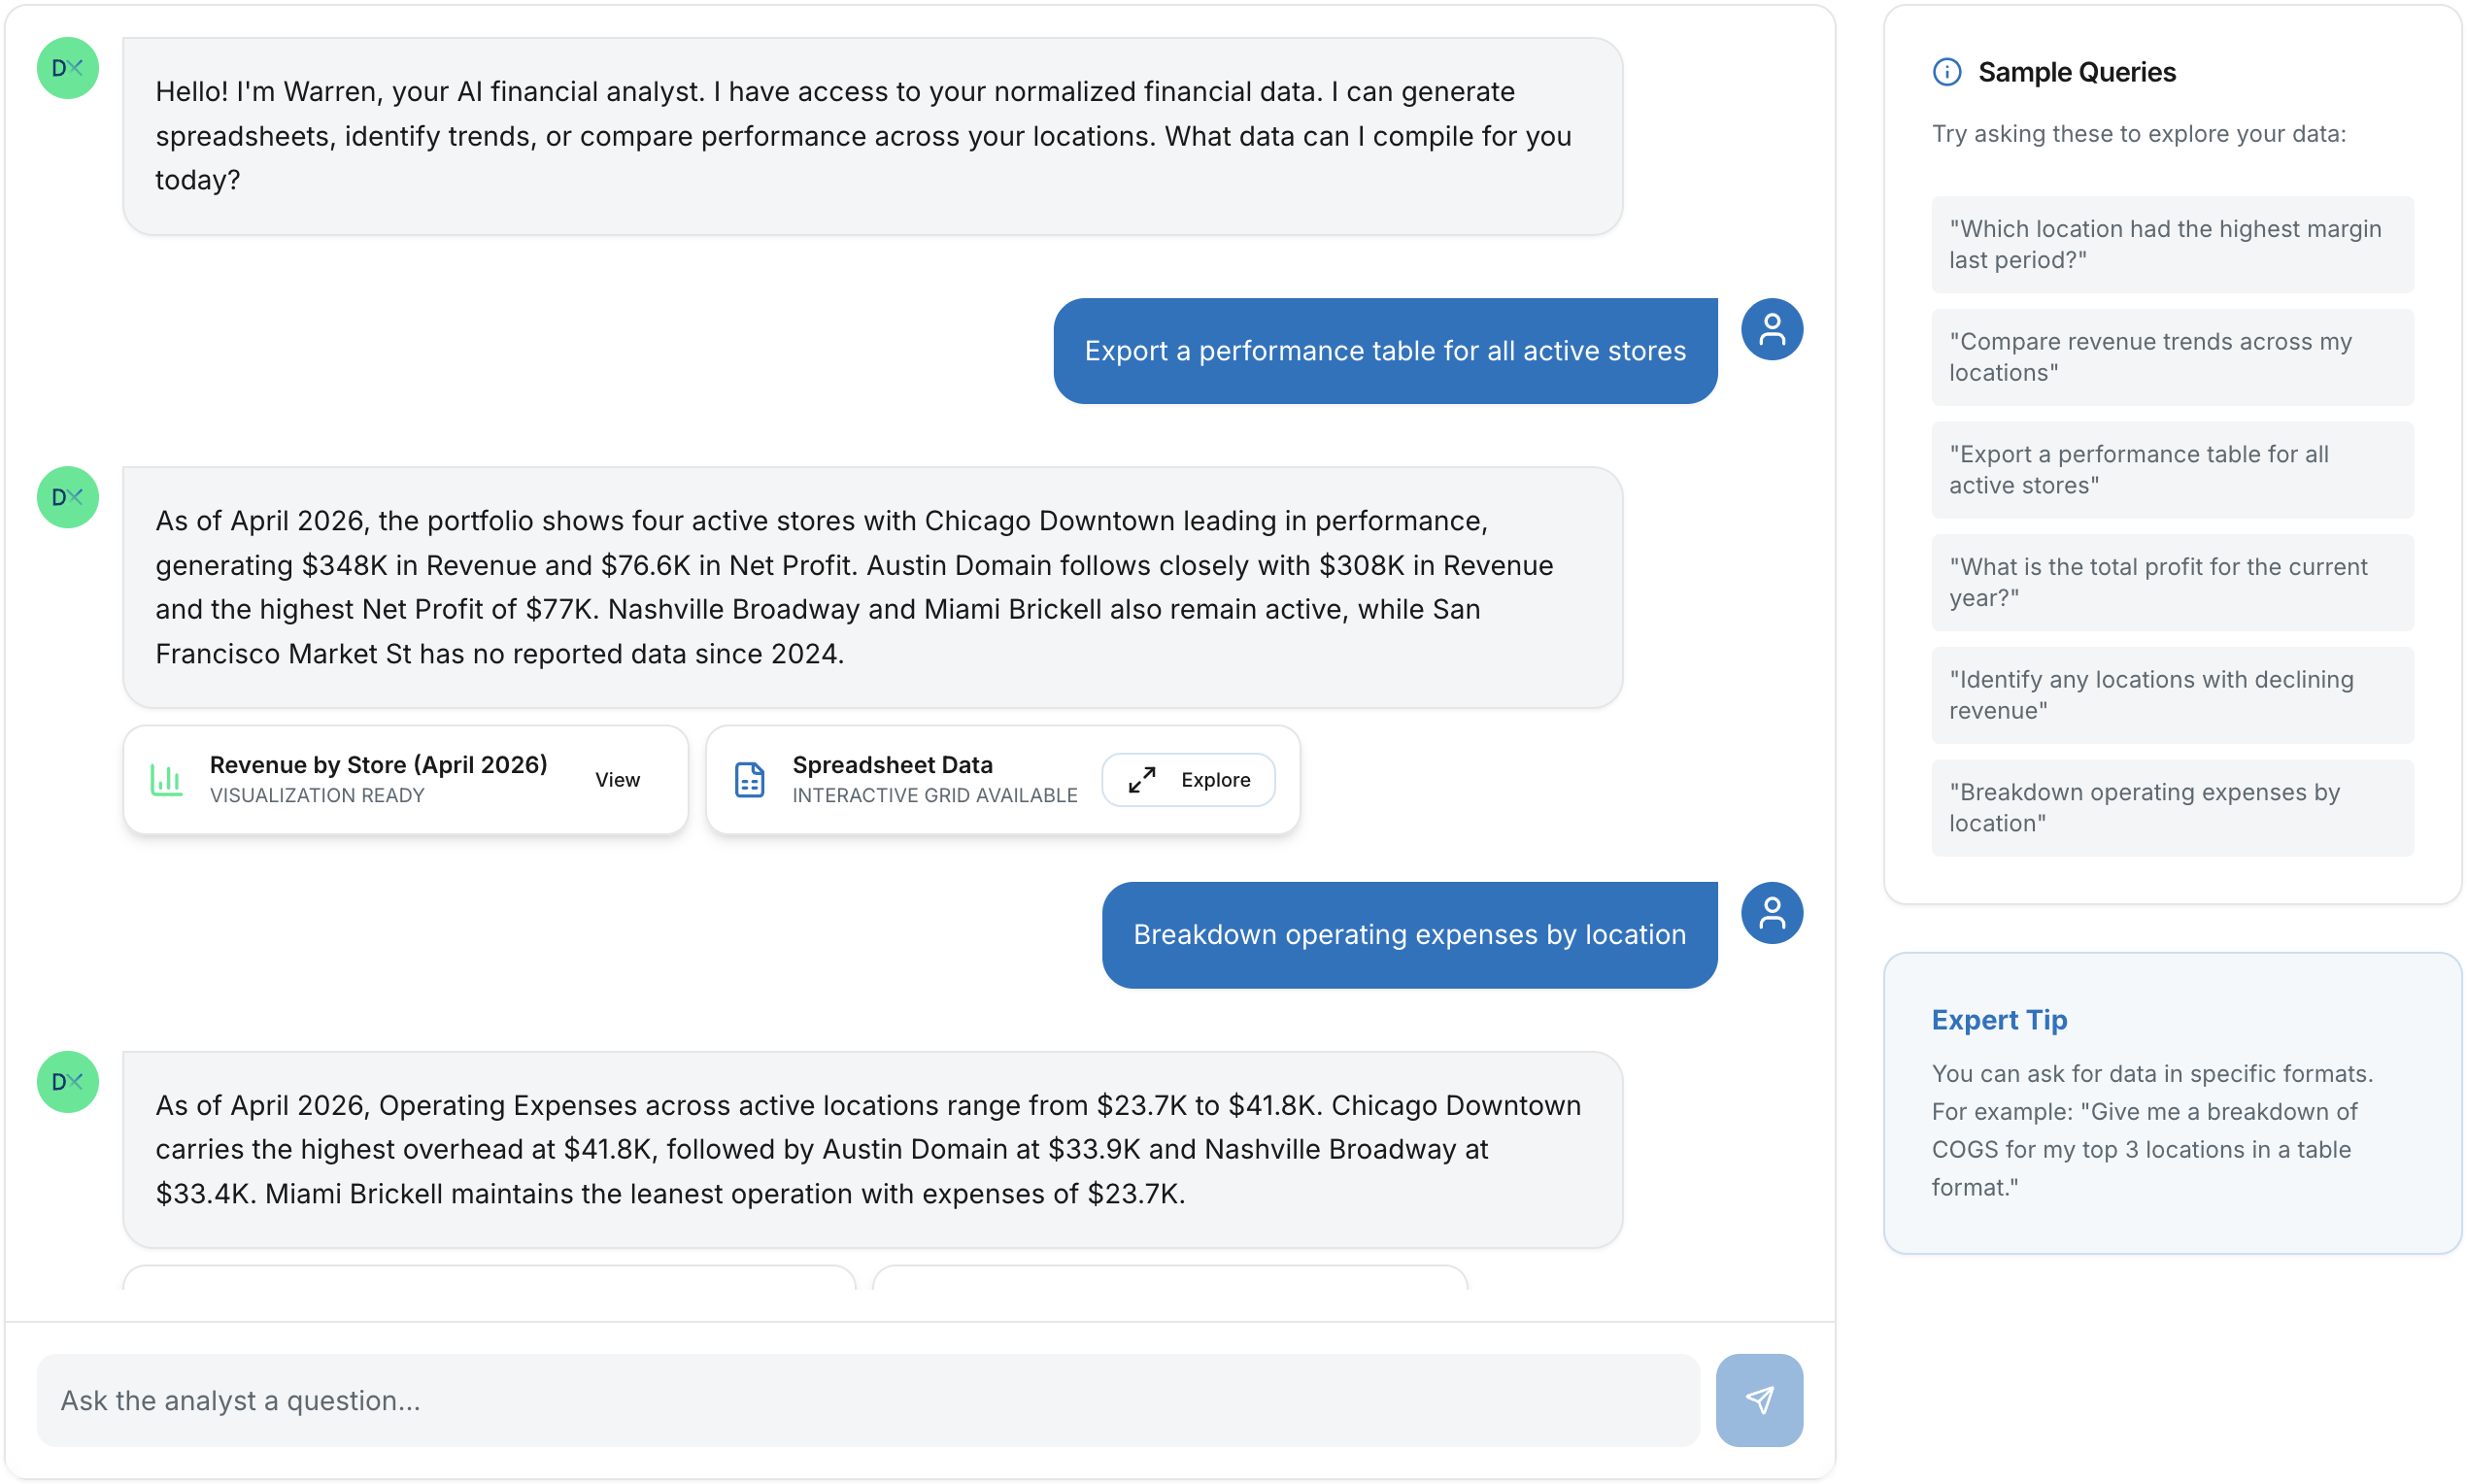
app.datatrixs.com/warren
Warren AI
AI Financial Analyst
Warren is your built-in financial analyst. Ask any question in plain English — about any unit, any metric,
any time period — and get a real answer with a supporting chart, table, or export.
Queries live financial data across all connected
business units
Generates tables, charts, and CSV exports in one
response
All insights saved to your library — searchable and
shareable
No SQL. No spreadsheets. No data analyst required.
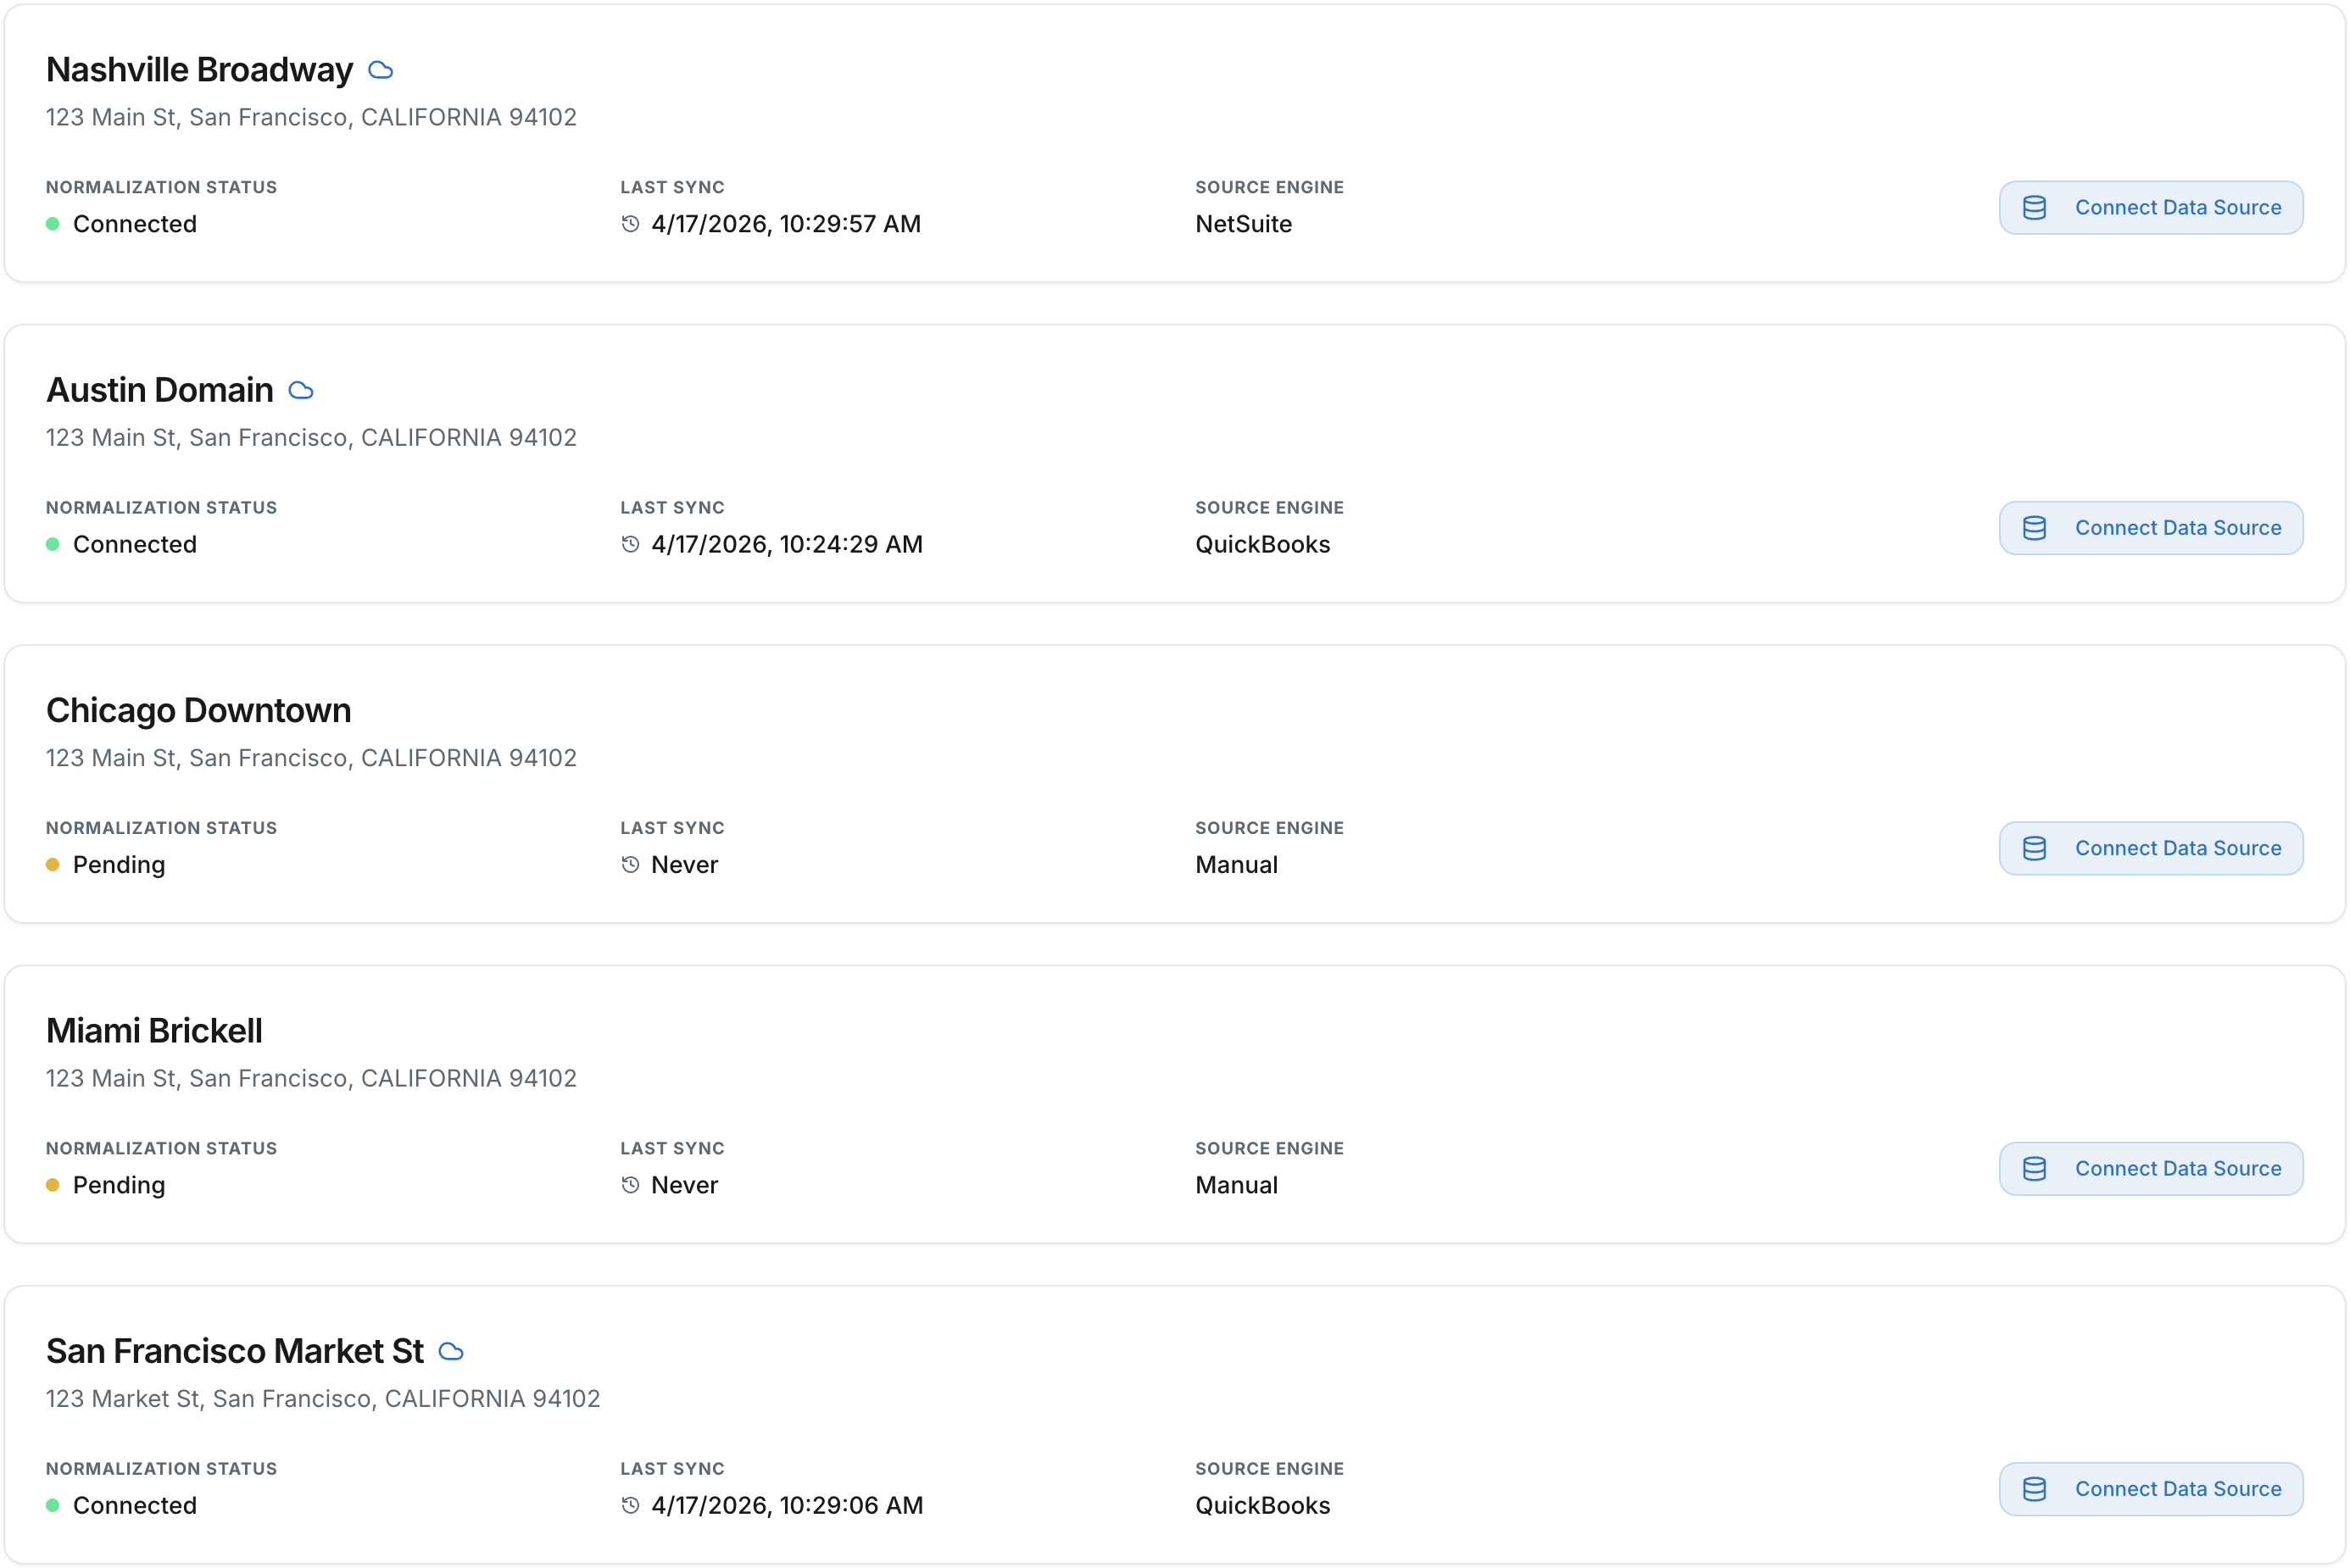
Multi-Unit Management
Add as many business units as your organization manages — locations, subsidiaries, product lines, client
accounts, or research programs. Each connects its own data source.
Add a new unit in under 2 minutes — connect data source,
name the entity, done
Normalizes chart of accounts across units with different
account structures
Parent-subsidiary org structures with inherited
permissions
app.datatrixs.com/units
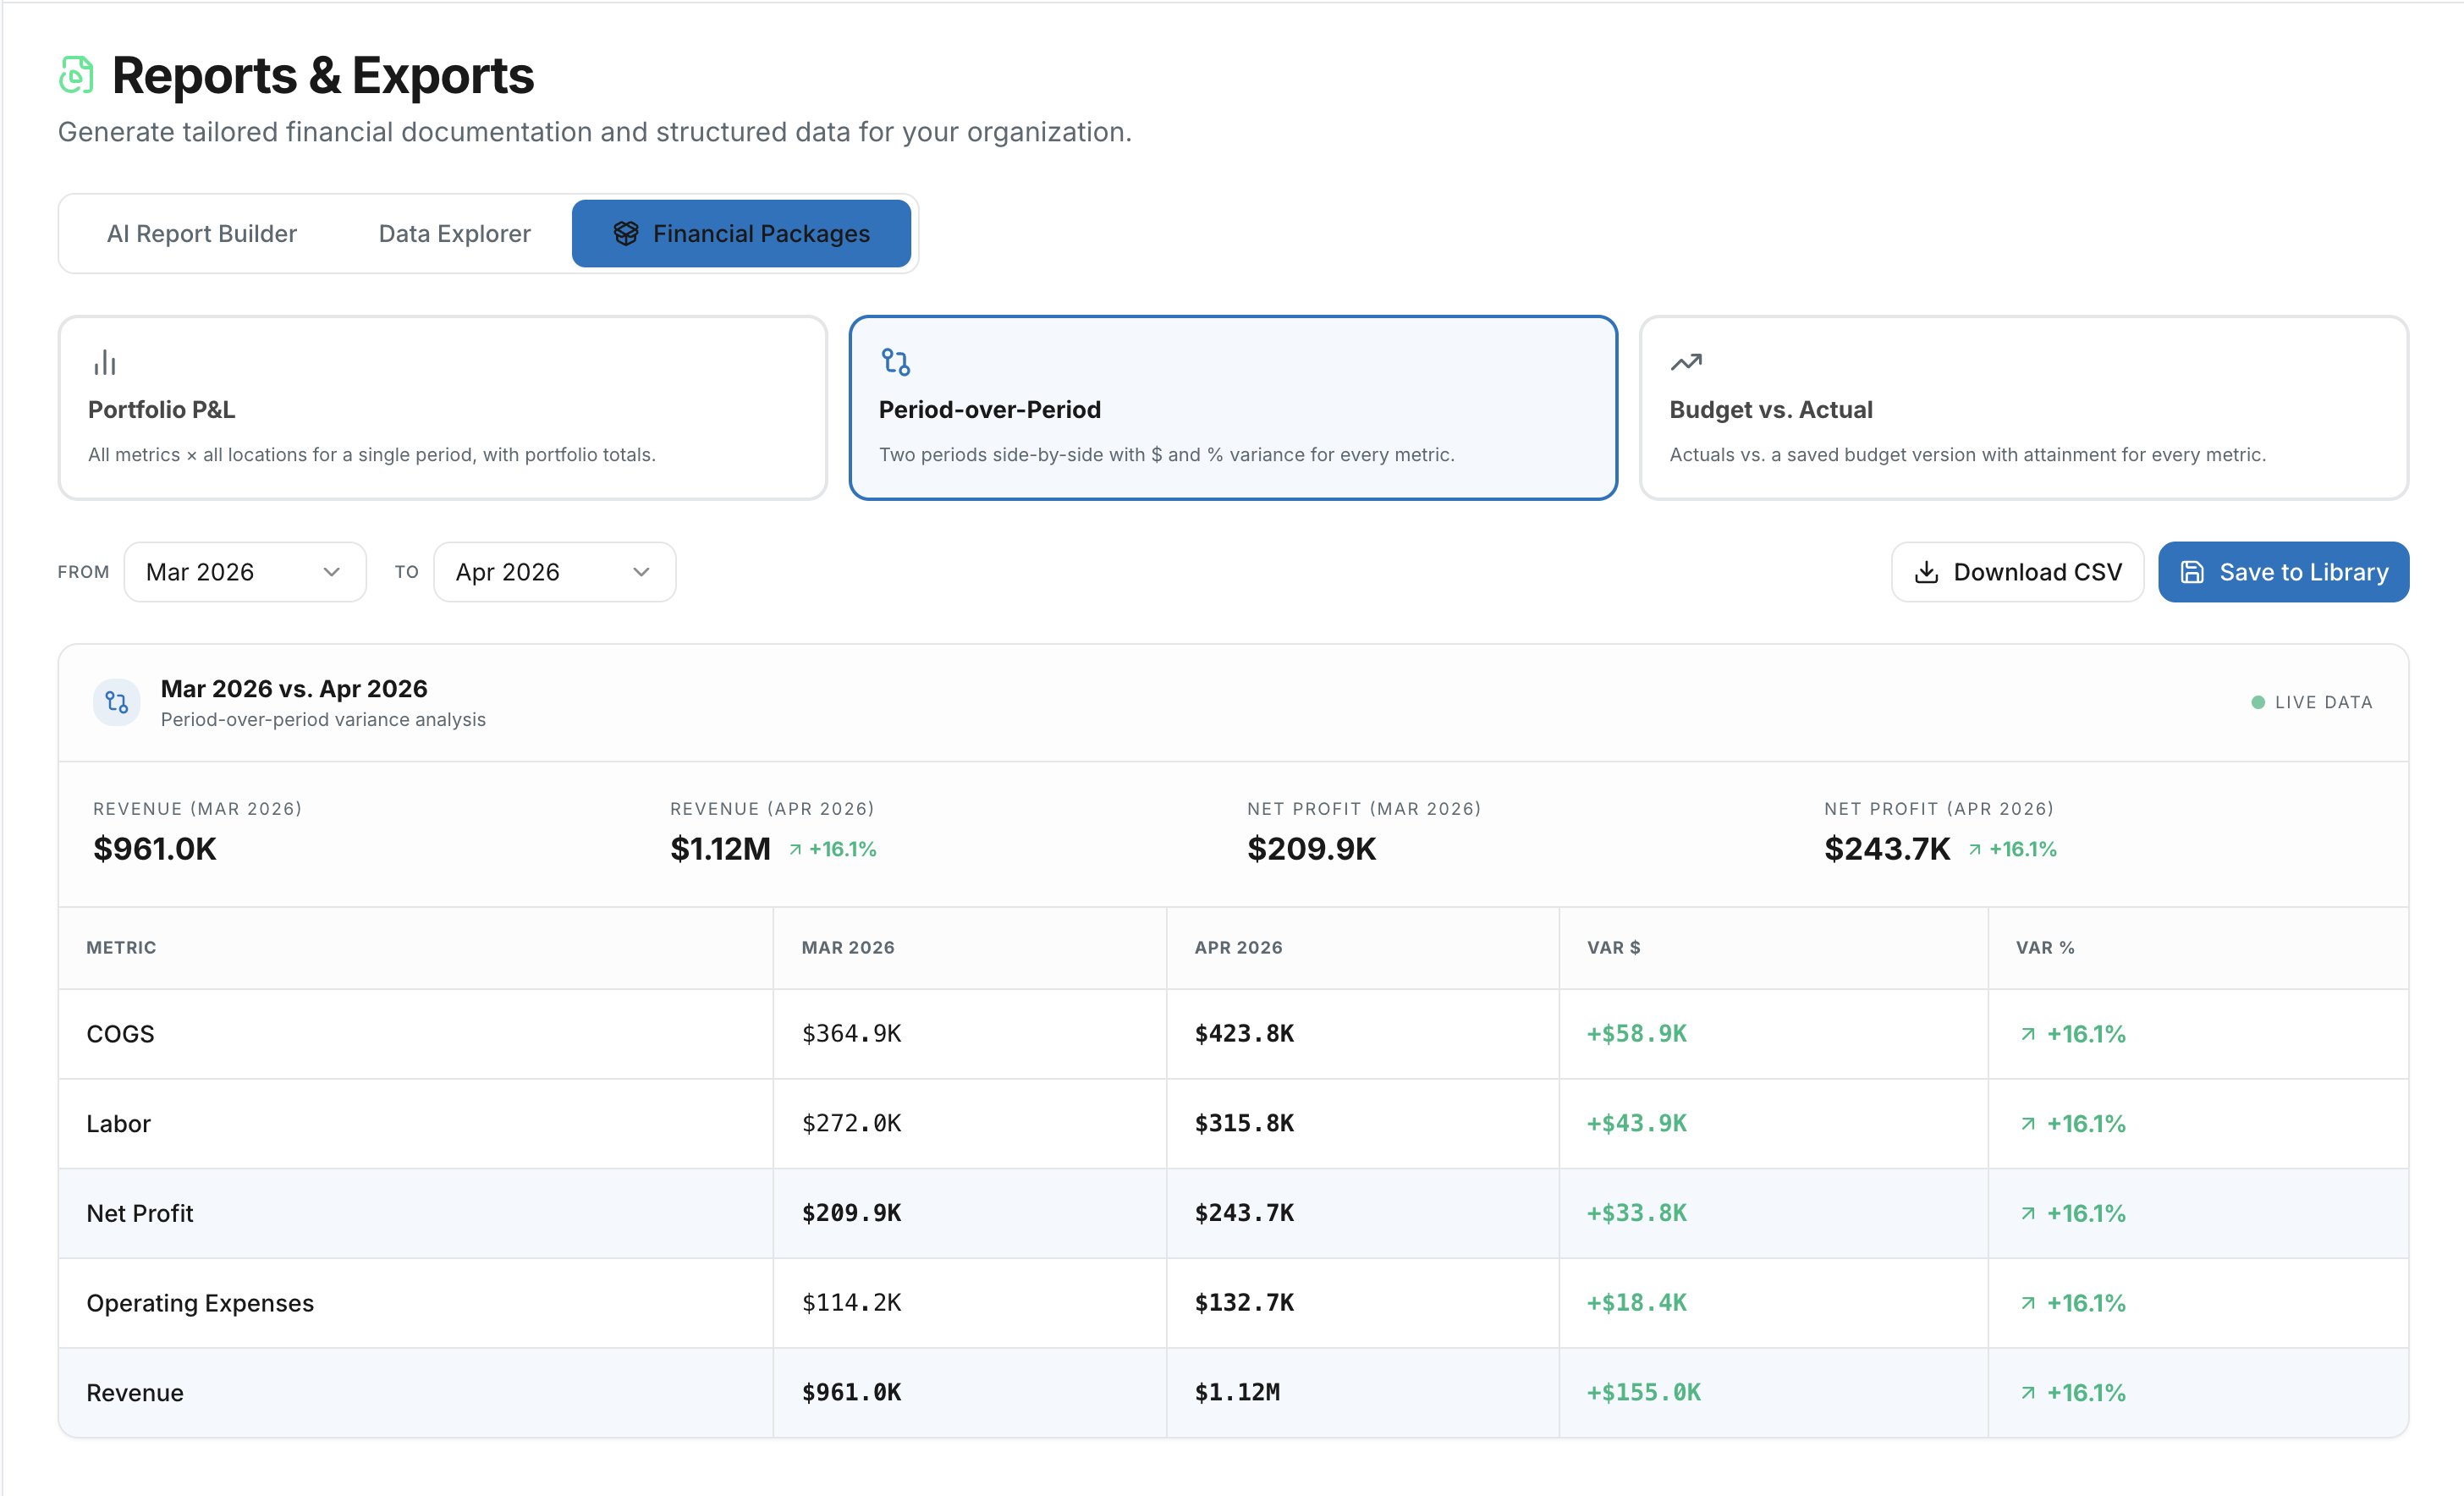
app.datatrixs.com/reports
Reports & Exports
One click to a formatted financial report. P&L, balance sheet, cash flow — for a single unit or your
entire portfolio — exported as structured spreadsheets or PDF-ready layouts.
Standard financial statements (P&L, B/S, CF)
instantly for any unit
Consolidated cross-entity reports with automatic
normalization
Structured CSV/Excel exports for audit-ready
deliverables
FP&A & Forecasting
Most financial planning happens in spreadsheets that break the moment a formula changes. Datatrixs FP&A lets you build Bear, Base, and Bull forecasts in one view — grounded in your actual normalized data. Set assumptions on the left. Watch your full P&L build on the right.
Bear / Base / Bull scenario builder with independent assumptions per scenario
New unit revenue ramp modeling with auto-derived AUV from your actuals
Live P&L projection: Revenue → Gross Profit → EBITDA with period-over-period deltas
Save forecast versions as budgets; track Plan vs. Actual automatically as data syncs
Vertical-aware by default
A biotech founder models R&D burn and milestone value. A retail operator models same-store sales growth and new unit ramp. Datatrixs adapts the entire forecasting framework — labels, defaults, and profit metrics — to your business model automatically.
Vertical
Profit metric
Retail
EBITDA
SaaS
Operating Income
Biotech
Operating Income/(Loss)
Prof. Services
Operating Income
Hardware
EBITDA
app.datatrixs.com/forecast
Bear
Base
Bull
12 periods
Assumptions — Base
SSS Growth+6.0%
New Units / Period2
COGS %31%
Metric
Bear
Base
Bull
Δ B/B
Revenue
$4.1M
$5.3M
$6.8M
+28%
Gross Profit
$2.7M
$3.6M
$4.7M
+30%
Labor
$1.1M
$1.4M
$1.7M
+21%
OpEx
$0.8M
$0.9M
$1.1M
+22%
EBITDA
$0.8M
$1.3M
$1.9M
+46%
Saved as FY2026 Base Budget — tracking vs. actuals automatically
More built in by default.
Capabilities that would
require separate tools elsewhere — included from day one.
Saved Library
Every AI insight, report, and export
saved automatically. Search by date, unit, or topic — share with your team in seconds.
Vertical Awareness
The platform adapts its KPIs,
terminology, and default queries to your business type — retail, SaaS, biotech, services, or hardware.
Role-Based Access
Assign view or edit access per user,
per unit. A unit GM sees only their data. A CFO sees everything. Enforced at the query level.
Org & Holding Structures
Model parent-subsidiary relationships.
Roll up entities under a holding or portfolio layer. Access and reporting follow the org chart.
FP&A & Forecasting
Bear, Base, and Bull scenario modeling grounded in your actuals. New unit ramp curves, live P&L projection, and automatic Plan vs. Actual tracking.
Ready to see your data in one place?
We'll connect your
accounting systems and walk through the platform with your actual data. No slides. No demos of fake companies.